IOP 10: 12-13 December 2001
Time Period of IOP
1800 UTC 12 Dec-0609 UTC 13 Dec
Overview of IOP
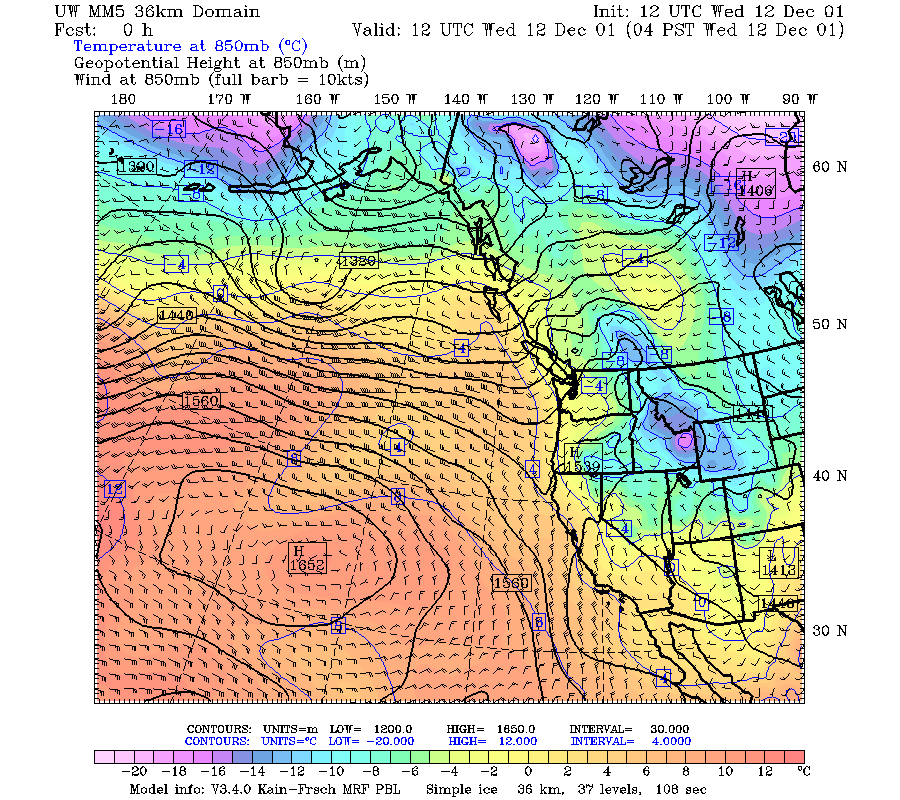
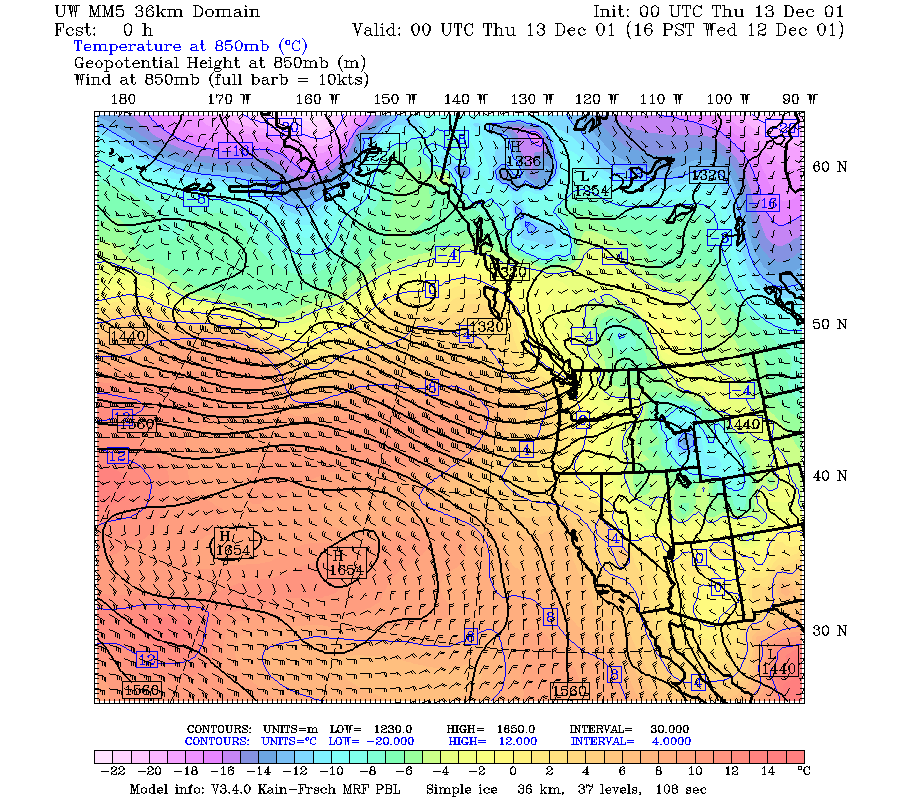
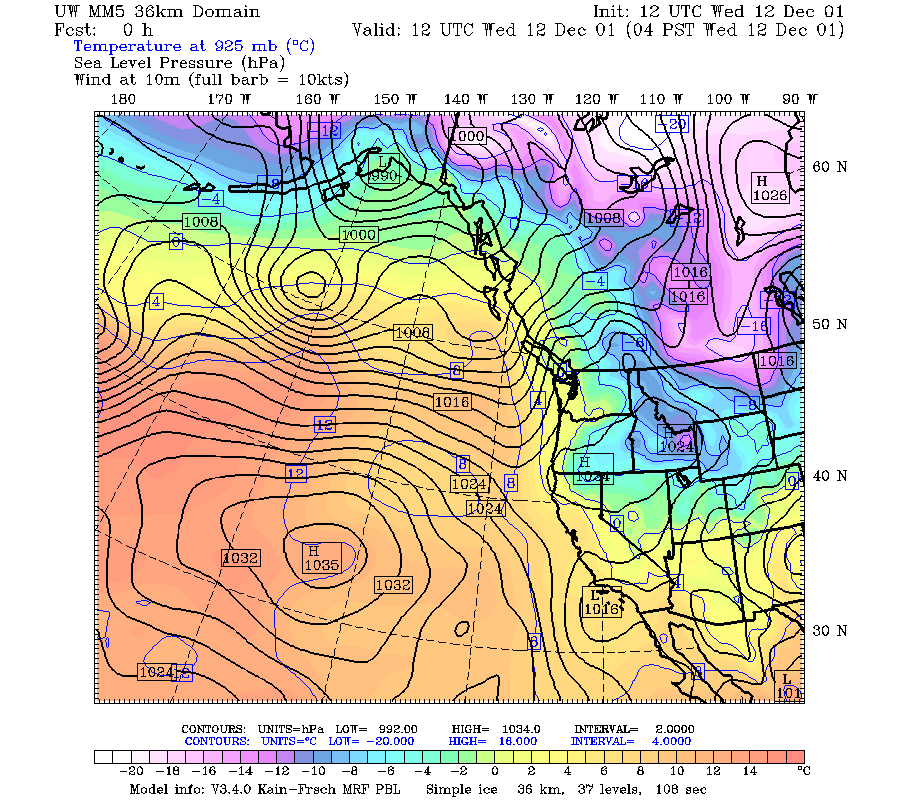
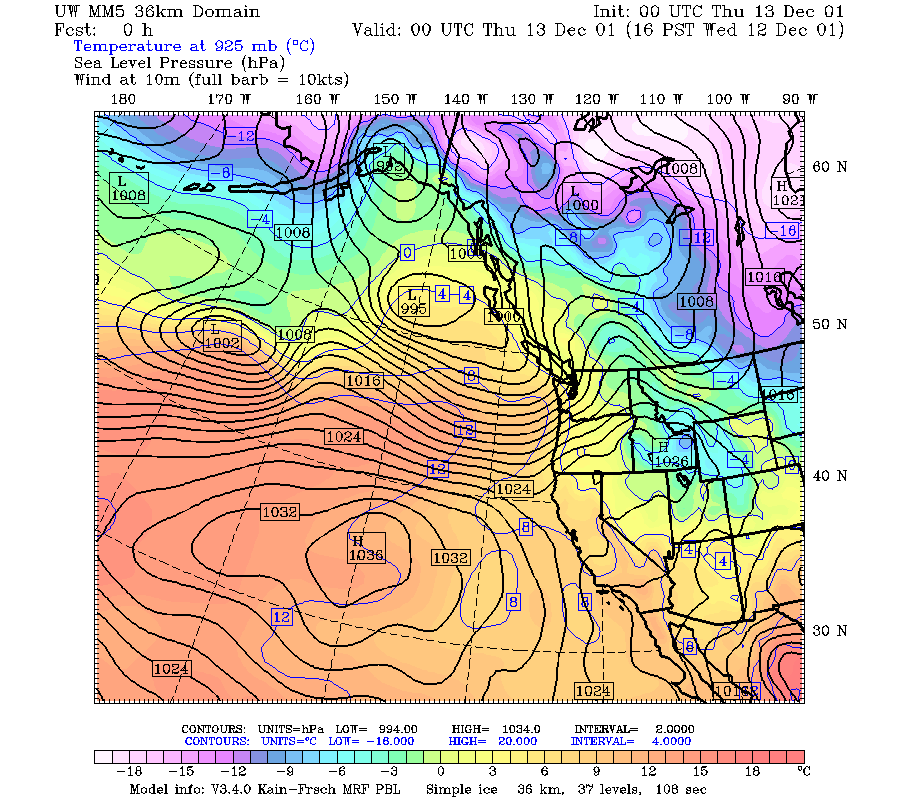
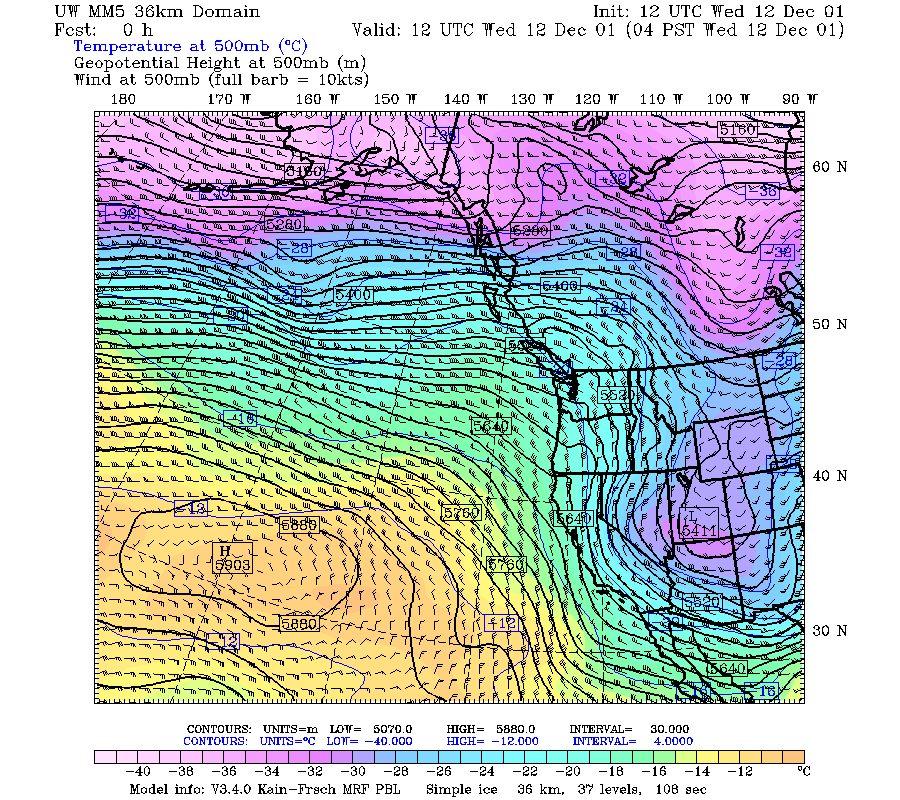
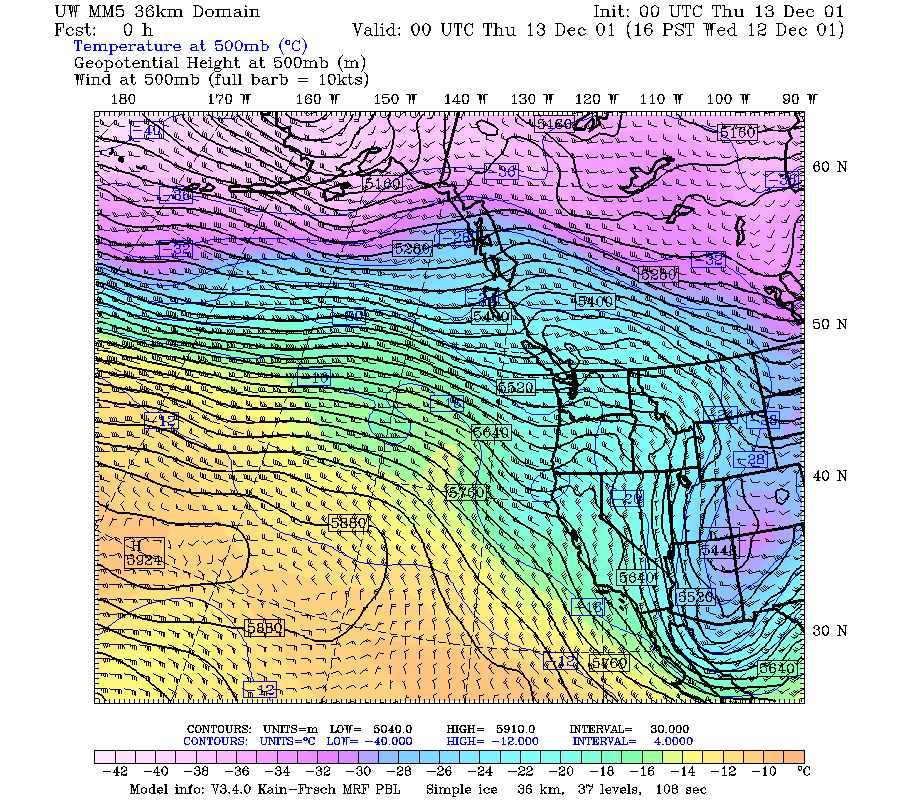
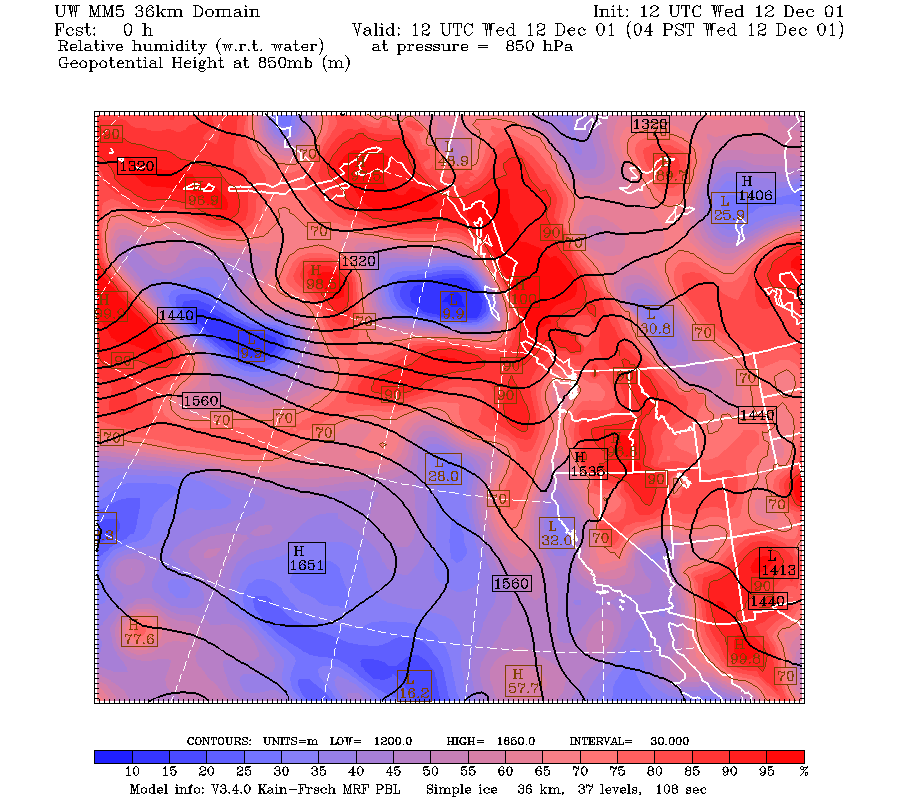
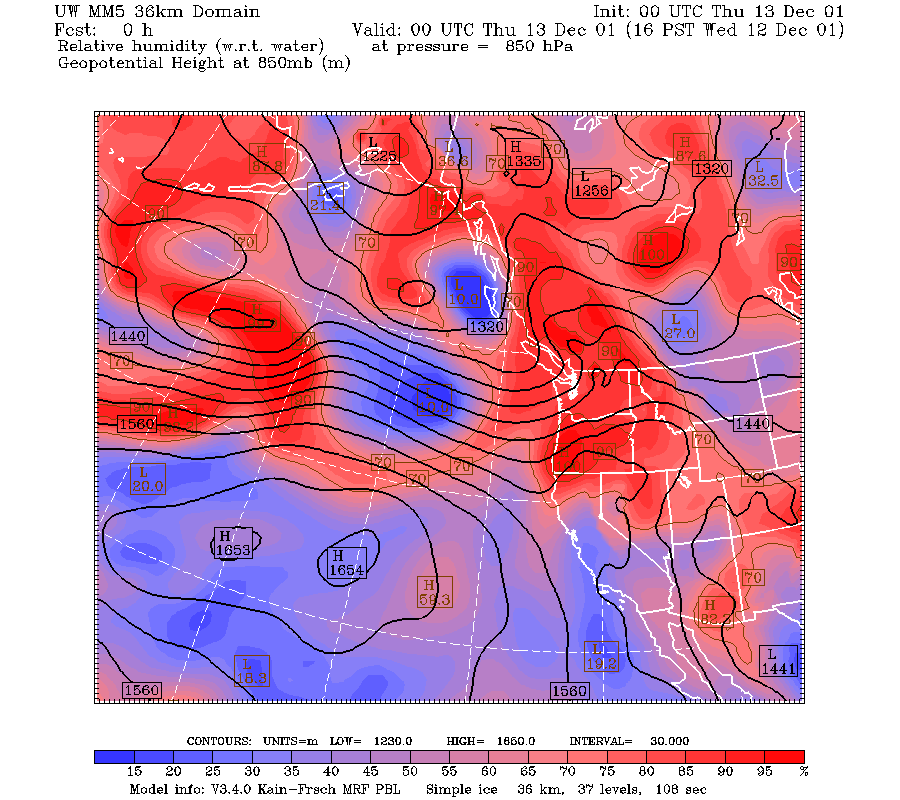
A barely perceptible trough at 137 oW at 1200 UTC 12 December 2001 UTC 12 December 2001 became better defined and was located on the Oregon coast at 0000 UTC 13 December (Fig. 1a, Fig. 1b). At 1200 UTC on 12 Dec, warm advection from a previous system was evident along the Oregon coast, and the formative trough at 137 west was just barely perceptible (Fig. 2a, Fig. 2b). By 0000 UTC the wind was stronger and southwesterly at 850 mb. The tongue of high relative humidity at 850 mb did not extend especially far south, only to about 25 oN (Fig. 3a, Fig. 3b). At the surface, the pressure gradient and warm advection intensified along the coast from 1200 UTC 12 December to 0000 UTC 13 December (Fig. 4a, Fig. 4b). Cold advection following this system was extremely weak.
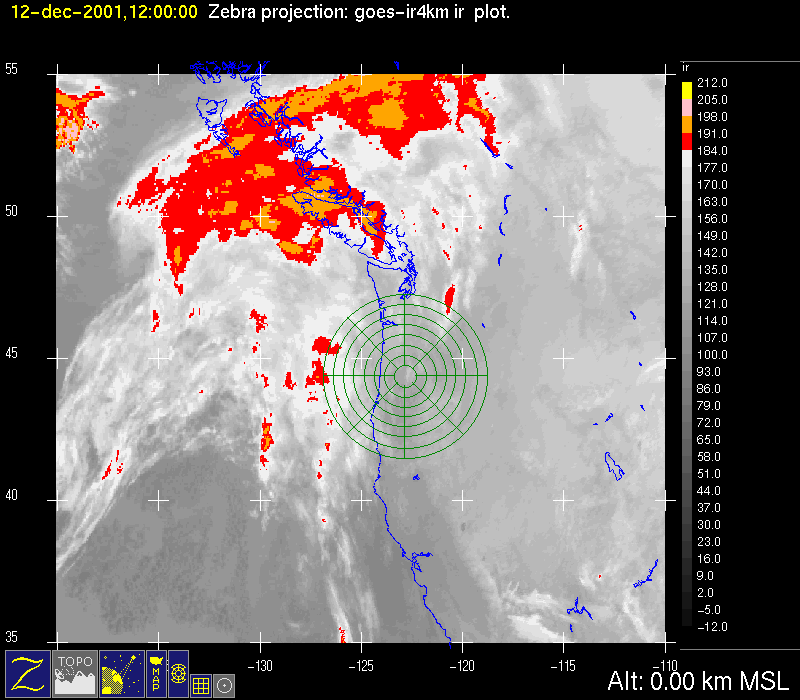
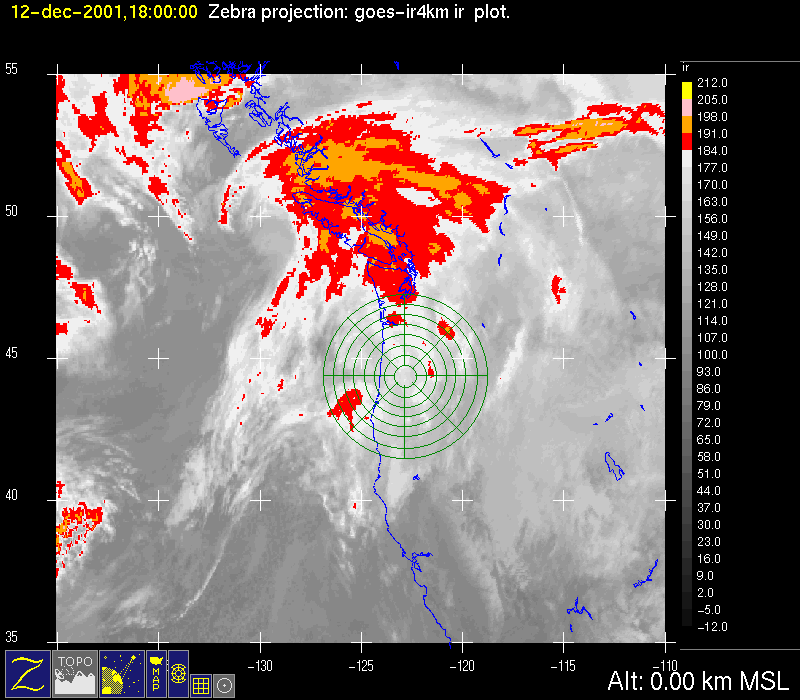
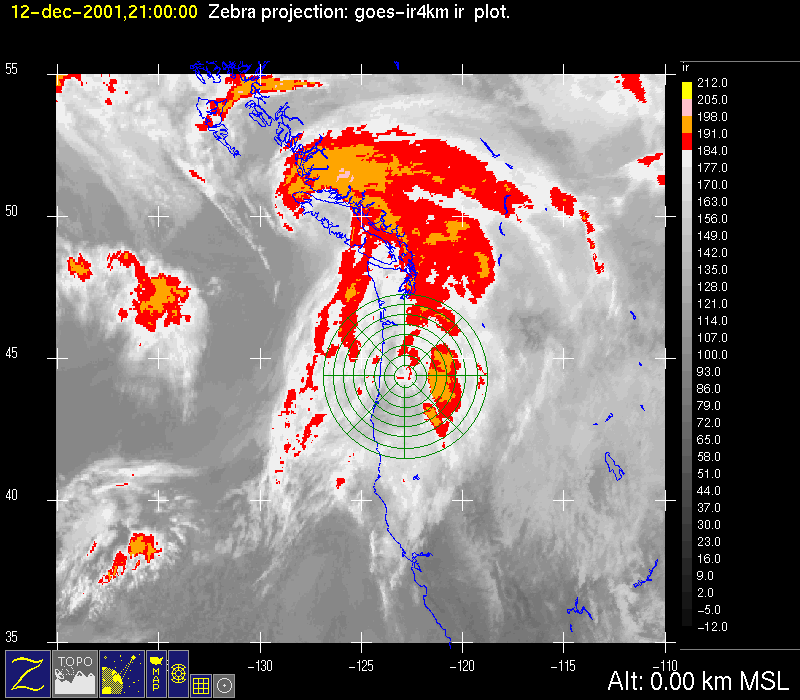
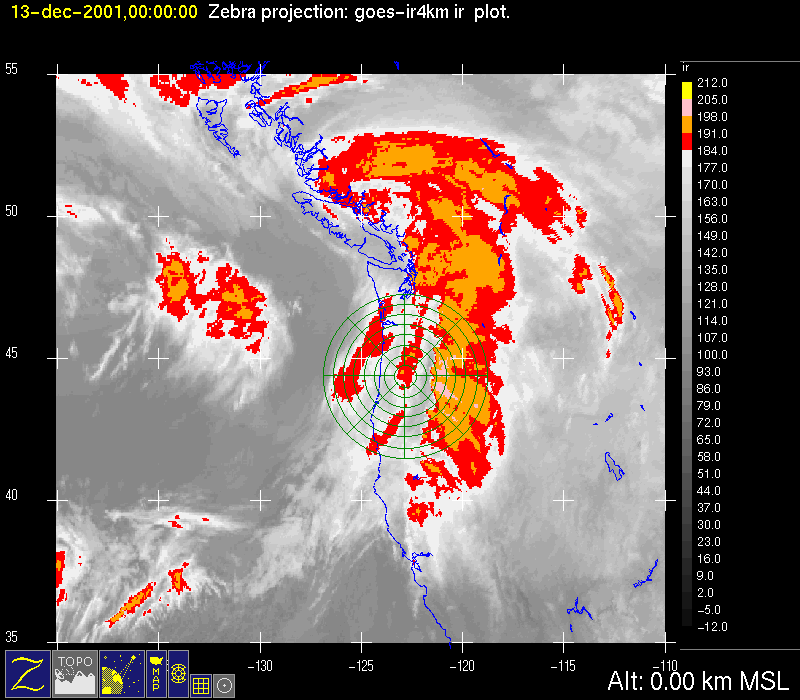
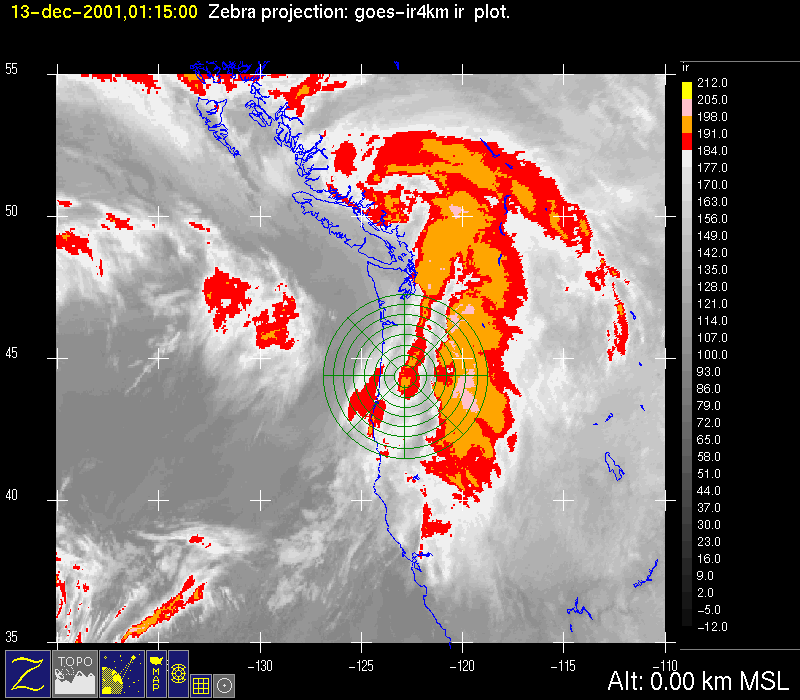
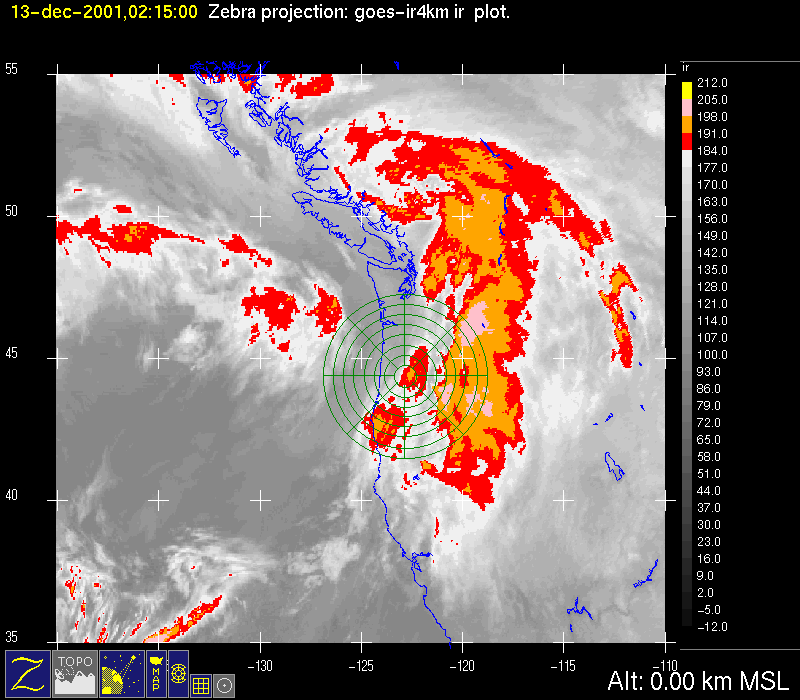
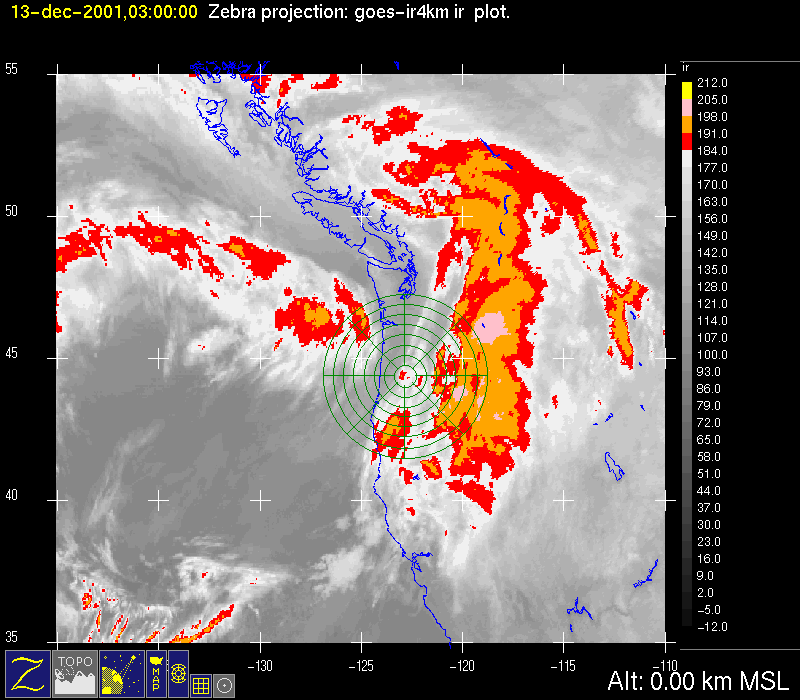
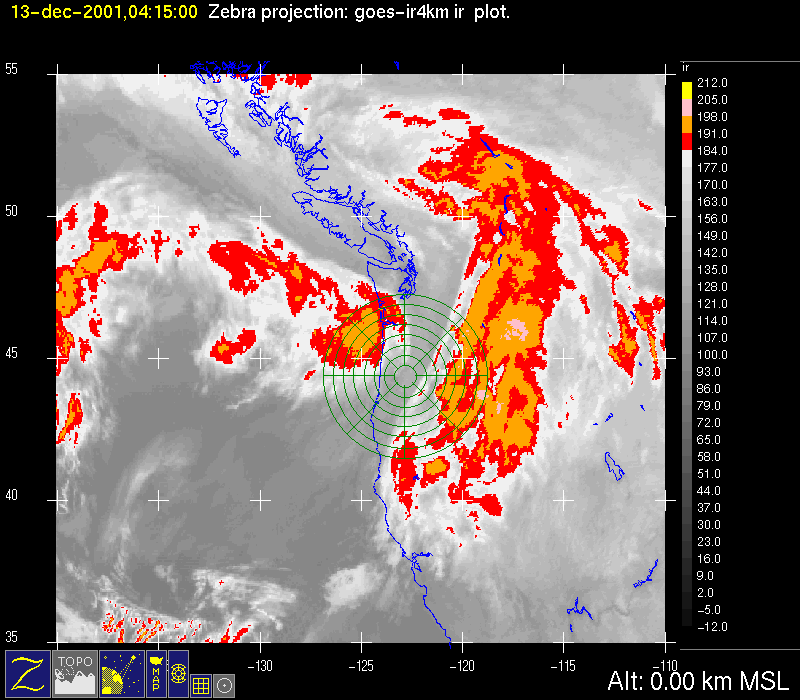
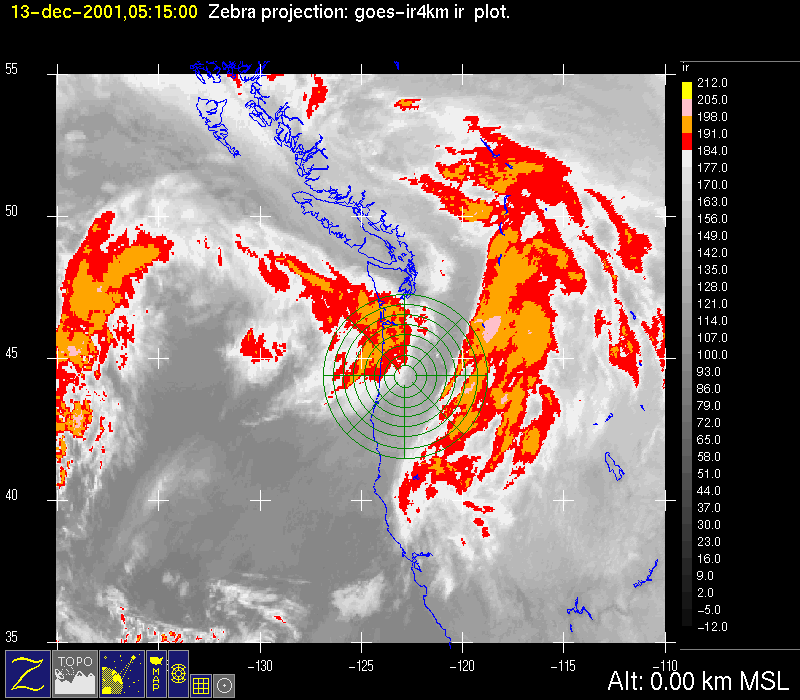
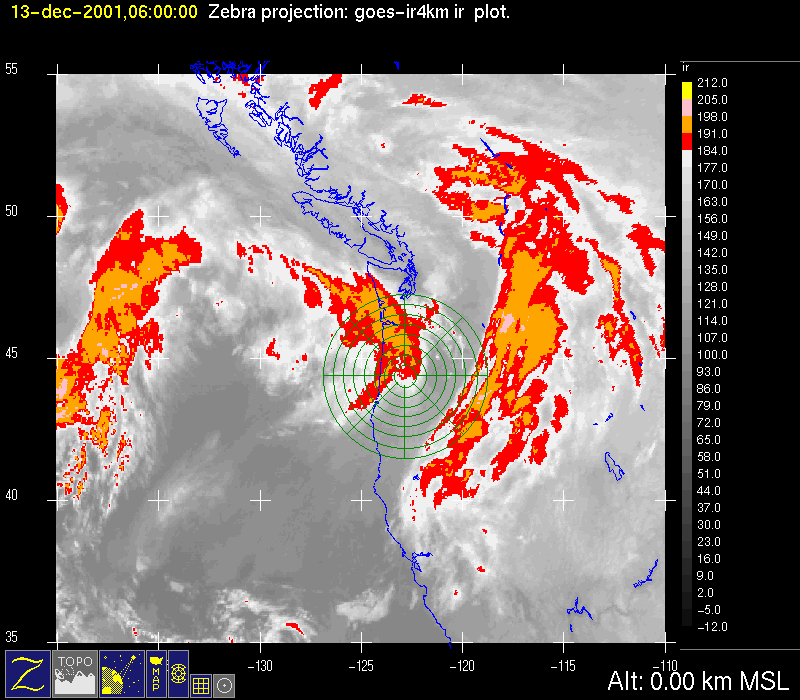
The infrared satellite imagery for 1200 UTC 12 December (Fig. 5a) showed clouds along the coast, apparently associated with the warm advection lingering there after the previous passed over the coast. This region of clouds eventually merged with the warm frontal region of the trough moving in from the west. The warm-frontal region of the cloud system was over the coastline and moving over the S-Pol radar area by 1800 UTC (Fig. 5b). By 2100 UTC (Fig. 5c), the warm-frontal part of the cloud system had become enhanced over the mountains, while the more intense cold frontal part of the cloud system was still over the ocean west of the S-Pol radar area.
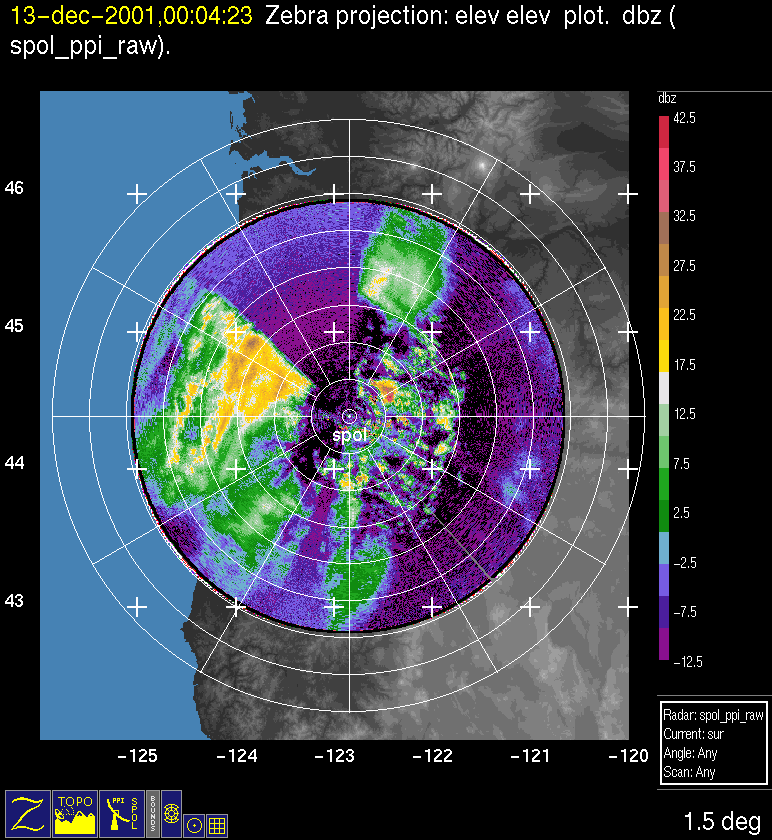
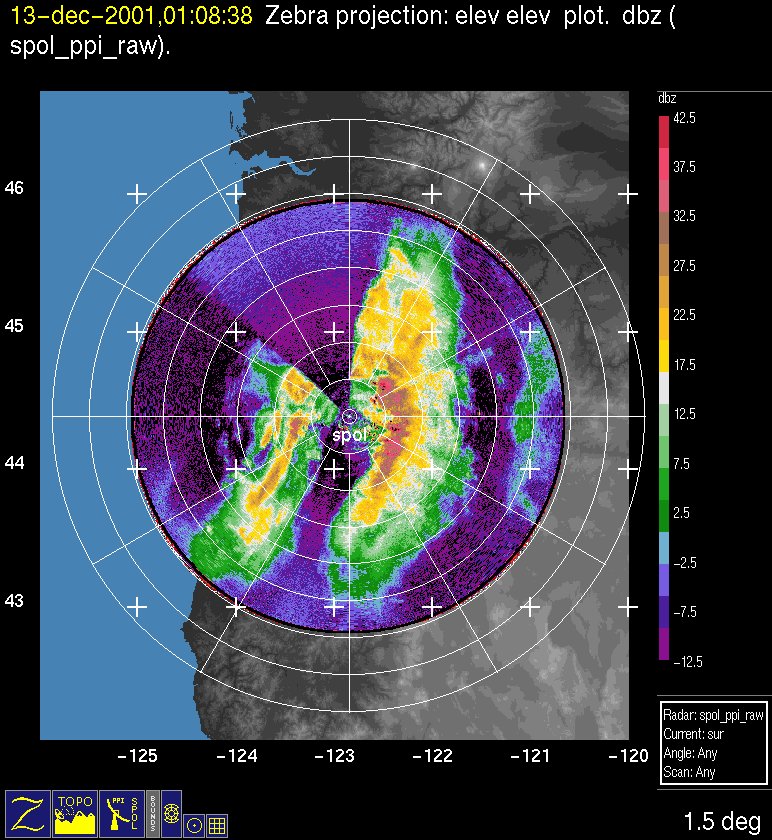
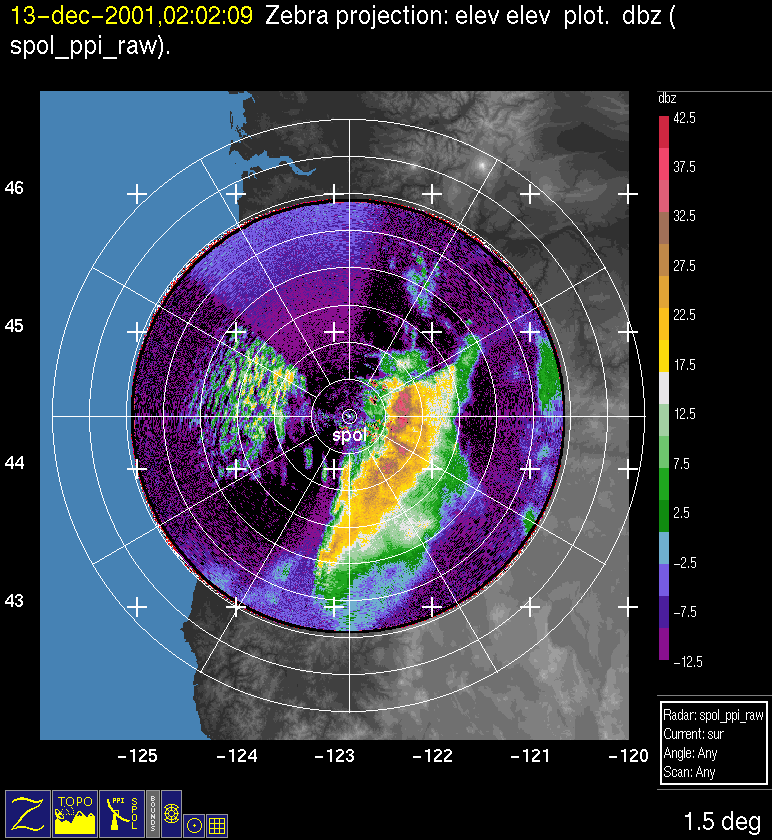
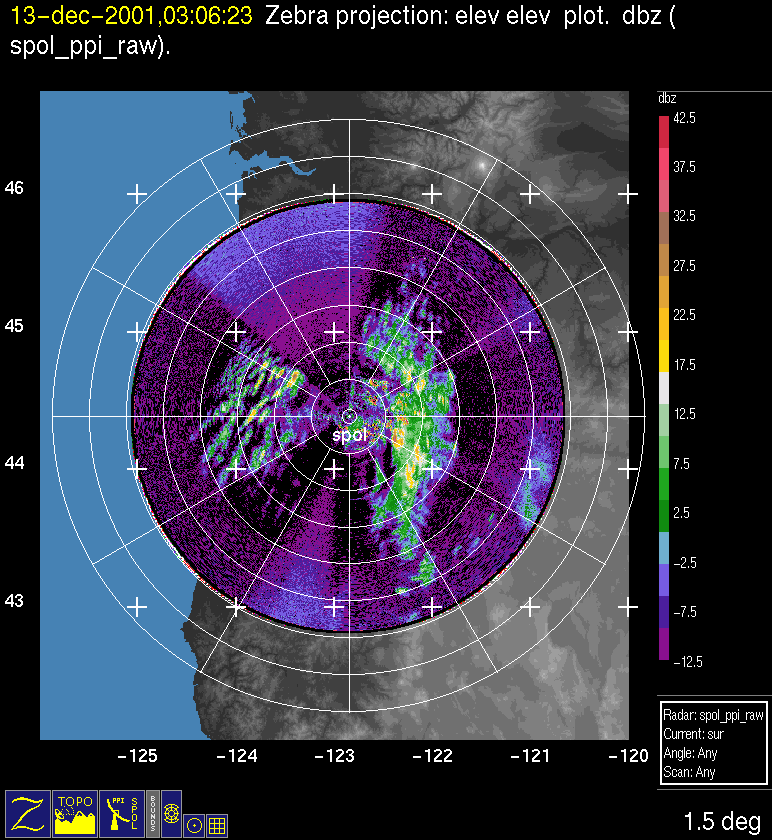
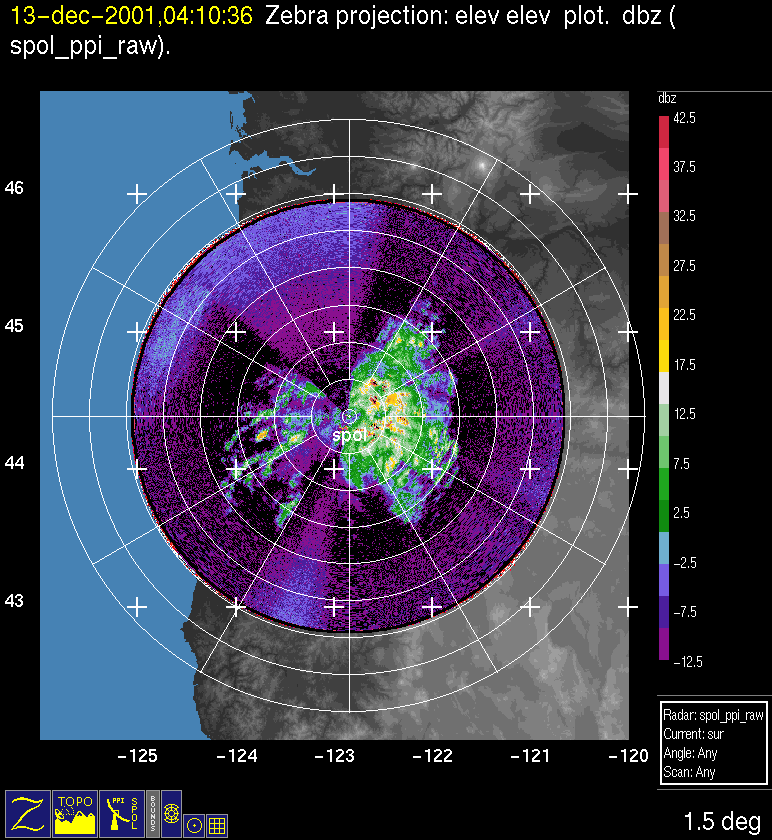
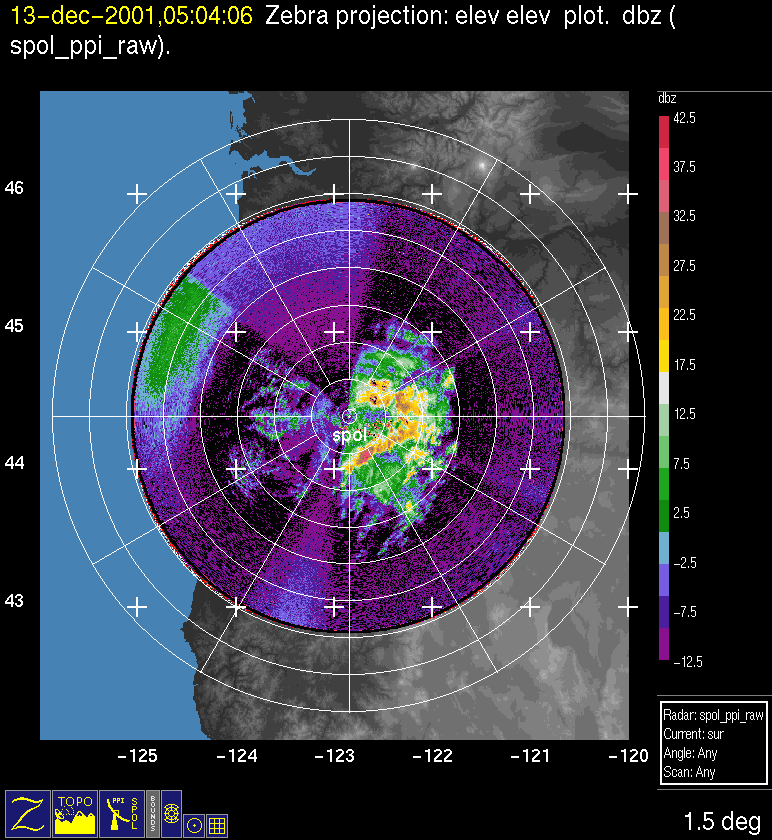
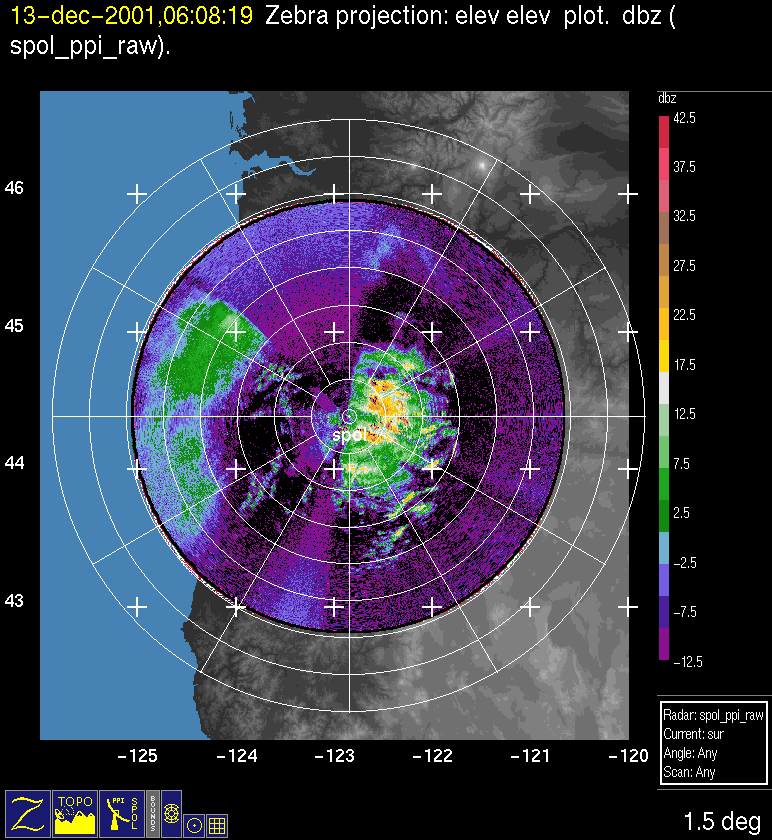
The Convair flew in this system from 2332 UTC 12 December-0548 UTC 13 December. The cold-frontal cloud and precipitation was moving over the western part of the S-Pol radar area at 0000 UTC (Fig. 5d, Fig. 6a). By 0100, the cold-frontal clouds had intensified over the mountains (Fig. 5e, Fig. 6b). At 0200 UTC the intensified frontal clouds over the mountains were still apparent, while weak postfrontal convective cells were appearing west of the radar (Fig. 5f, Fig. 6c). At 0300-0400 UTC the postfrontal convection was over the mountains and more was west of the radar, while a patch of intensified clouds was evident over the oceans on the leading edge of the warm advection region of the next frontal system approaching from the west (Fig. 5g, Fig. 5h, Fig. 6d, Fig. 6e). This patch of cloudiness was moving over the S-Pol radar area during the period 0500-0600 UTC (Fig. 5i, Fig. 5j, Fig. 6f, Fig. 6g).
Convair-580 Summary
UW Flight Number:
1899
Period of Flight:
2329 UTC 12 December-0549 UTC 13 December 2001
Main Accomplishment of Flight:
Profile over Santiam Pass in moderate precipitation (frontal passage?).
Instrument Problems:
PMS 1-D cloud probe counting in clear air. PMS 2-D cloud probe (?). Icing of FSSP-100.
Flight Scientist:
Nick Bond
Approximate UTC Timeline (Local time= UTC-8 hours) Activity for UW Flight 1899:
2329 |
Engines on. |
2334 |
Out of blocks. |
2345 |
Takeoff. |
2356 |
Potential science power problems. |
0005 |
HPVS and 2-DC probes look okay. |
0020 |
Lat 46˚/long 123˚, undercast just below flight level 16,000 ft. |
0031 at 45˚34'/123˚33' |
17,000 ft, wind 290 @ 27 m s–1. In clear air between undercast and thin overcast; some ice settling from aloft. |
0046 at 44˚41'/124˚14'. |
Changed west point 30' east. |
0049 at 44˚31'/124˚11' |
Main cloud decks coming together. Surprising winds (from ~300˚). Beginning first run at 18,000 ft. 2-DC and HVPS probes functioning. Temp –19˚C, wind ~300 @ 25 m s–1. |
0057 |
Very near cloud top; only small crystals showing on HVPS. |
0106 at 44˚20'/122˚48' |
Hitting higher ice crystal concentrations but near east end of precipitation band. |
0109 |
End of first east-west run; starting westward descent. |
0114 |
Suspicious winds (52 m s–1!). |
0117 . |
HVPS acting odd last 5 min |
0119 |
Out of precipitation, co-pilot's airspeed indicator out à bad winds. |
0126 |
End of second east-west run; between decks. |
0128 |
Beginning third east-west run at 16,000 ft.. |
0137 |
Early part of leg mostly in clear air. |
0138 at 44˚24'/122˚48'. |
Considerable concentrations of ice; some relatively large. |
0139 |
Airspeed and winds back (200˚ @ 24 m s–1). |
0142 |
End of third leg, TA -14. |
0143 |
Airspeed/winds bad again. Heading west. |
0147 at 44˚24'/122˚31'. |
Heavier precipitation here, light chop, winds back. Little precipitation aloft at west end of leg. |
0158 |
End of fourth leg; CLR. |
0200 |
Begin fifth east-west at 14,000 ft; between decks. |
0209 at 44˚25/122˚18'. |
In light precipitation. |
0348 |
Shed ice on viewing bubble. |
0350 |
In fairly thick cloud; few or zero large particles. |
0353 |
At 8,000 ft wind 250˚ @ 20 m s–1. Ice building up again. |
0356 |
Mostly out of precipitation; shedding ice again. |
0358 |
2-DC probes temporarily obscured. |
0359 |
Descending to 6,000 ft. |
0400 |
Descending to 4,000 ft. Freezing level about 5,000 ft. |
0405 |
Descending to 3,500 ft for CCN legs, then 3,000 ft, then 2,500 ft. |
0410-0415 |
Trying to find locally higher cloud bases. |
0417 |
Starting CN counter. Short intervals of diffuse thin clouds. |
0420-0424 |
Mostly in cloud, CN measurements compromised. |
0431 |
Finished low-level work not much below cloud base. |
0436 |
Freezing level about 8,000 ft. |
0458 |
In ice on ferry home. Temperature ~–15˚C. |
0509 |
Ice over. |
0526 |
Shutting down data systems. |
0544 |
Landed. |
0549 |
Engines off. |
P-3 Summary
No flight
S-Pol Radar Summary
The S-Pol radar was run continuously in the same mode of operation for the entire length of the field project.
Summary of Mobile Upstream Sonde Launches
Launch times at: Rowland, OR, Lat: 44.2800, Lon: -123.0650, Elev: 97 m
2110 UTC 12 Dec
2357 UTC 12 Dec
0226 UTC 13 Dec
0609 UTC 13 Dec
Summary of Leeside Sonde Launches
Launch times at: Black Butte Ranch, OR (a.k.a. ISS-3), Lat: 44.379, Lon: -121.679, Elev: 1027 m
2100 UTC 12 Dec
0000 UTC 13 Dec
0300 UTC 13 Dec
0600 UTC 13 Dec
Summary of NWS Sonde Launches from Salem (SLE)
Launch times:
1800 UTC 12 Dec (special)
2100 UTC 12 Dec (special)
0000 UTC 13 Dec (standard)
0300 UTC 13 Dec (special)
Summary of Snow Crystal Ground Measurements
Measurement times:Every 15 minutes from
2100 UTC 12 Dec-0445 UTC 13 Dec (at Santiam Pass, Corbett, and Tombstone Sno Park)
