IOP 7: 5-7 December 2001
Time Period of IOP
2125 UTC 5 Dec-0030 UTC 7 Dec
Overview of IOP
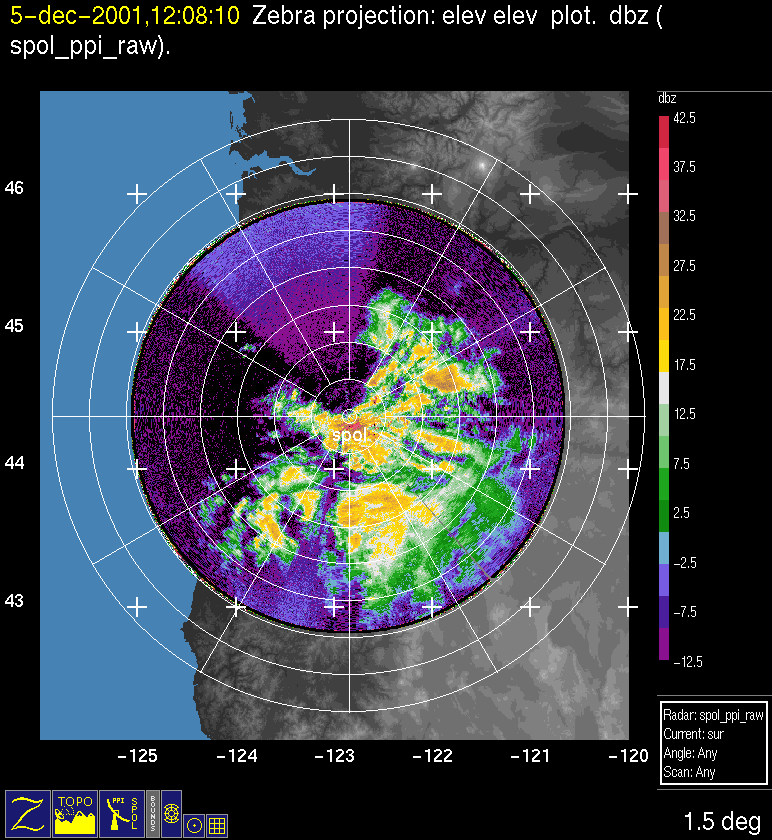
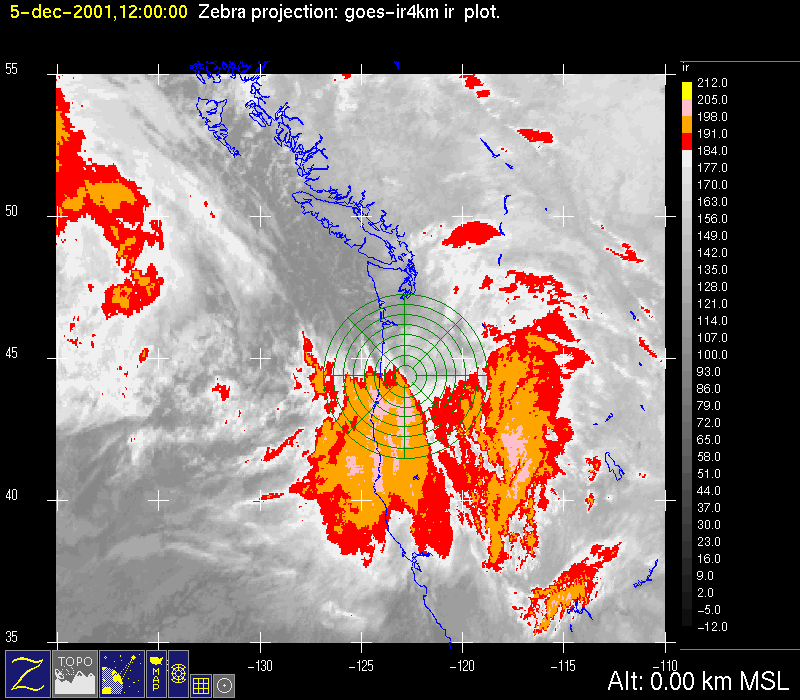
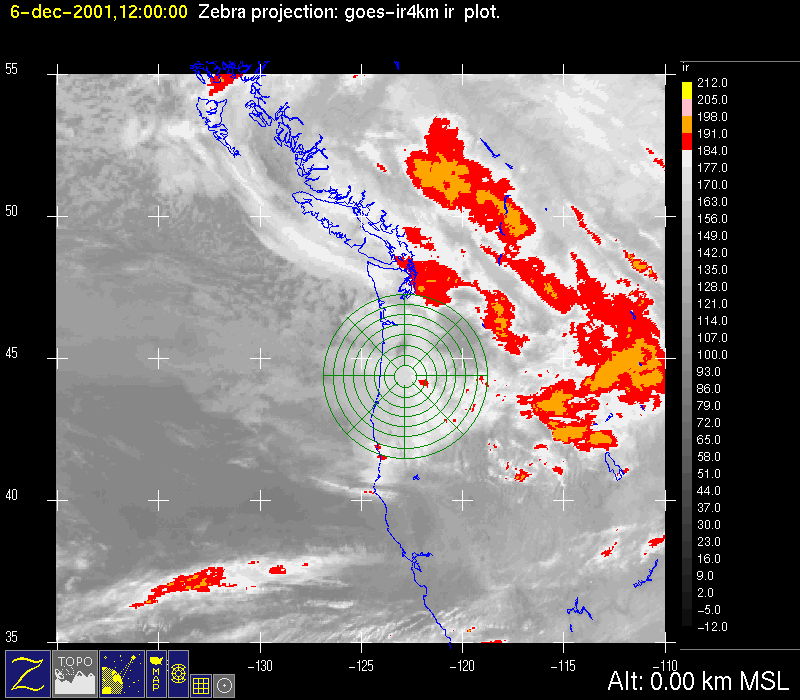
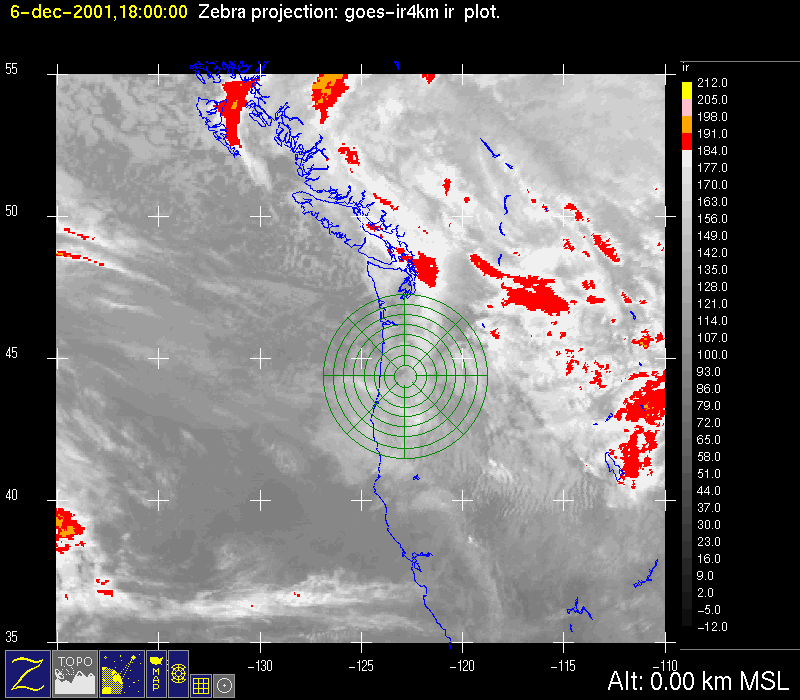
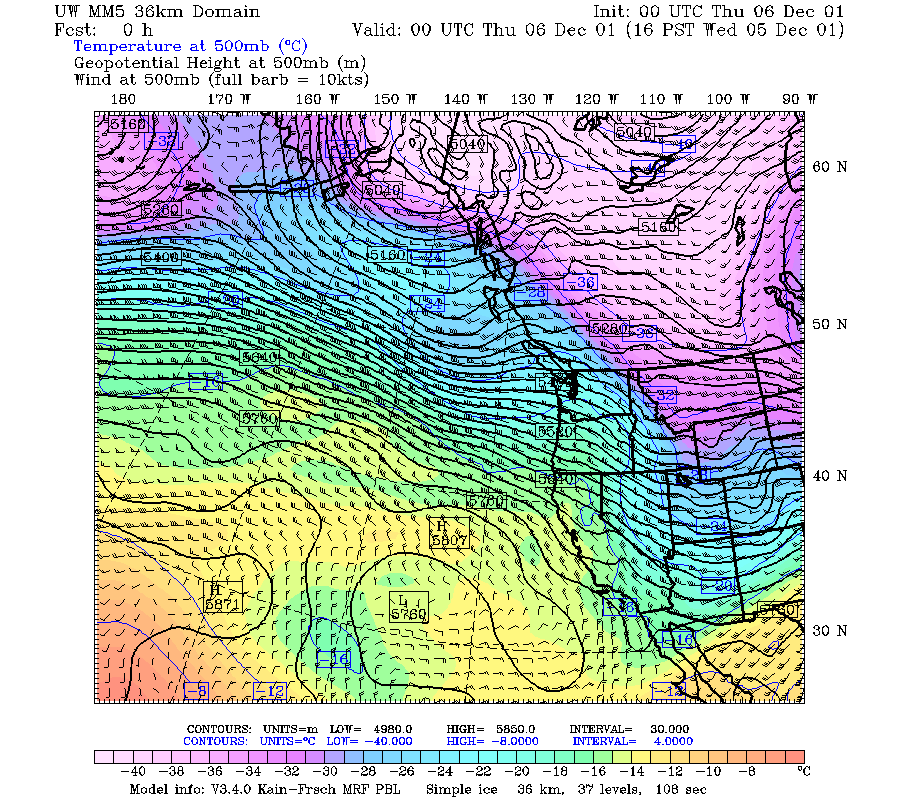
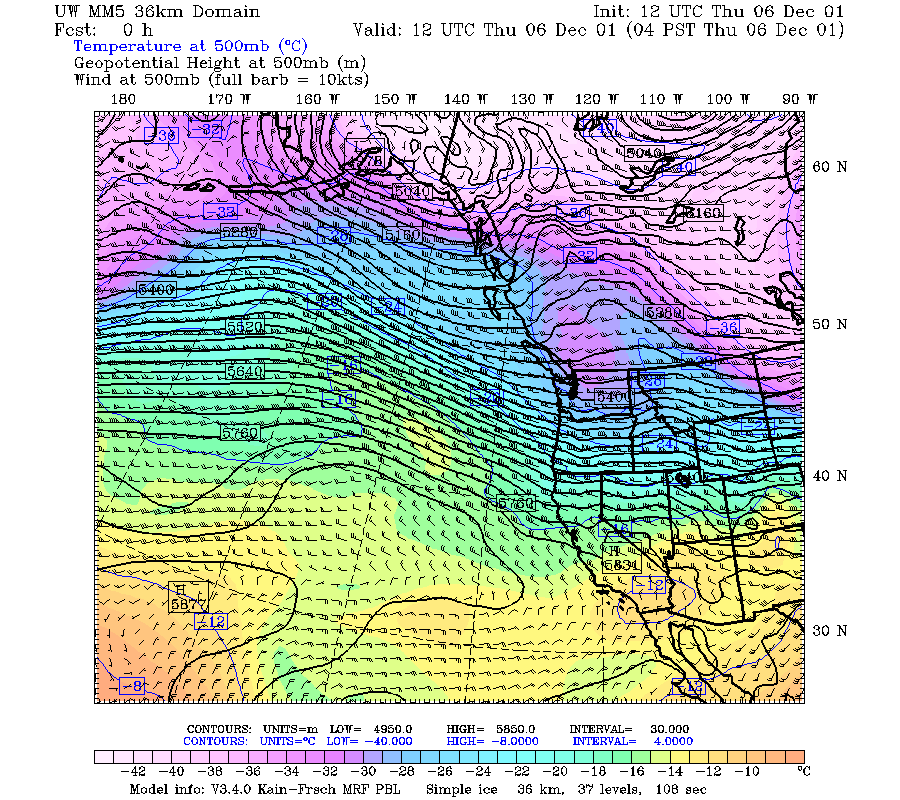
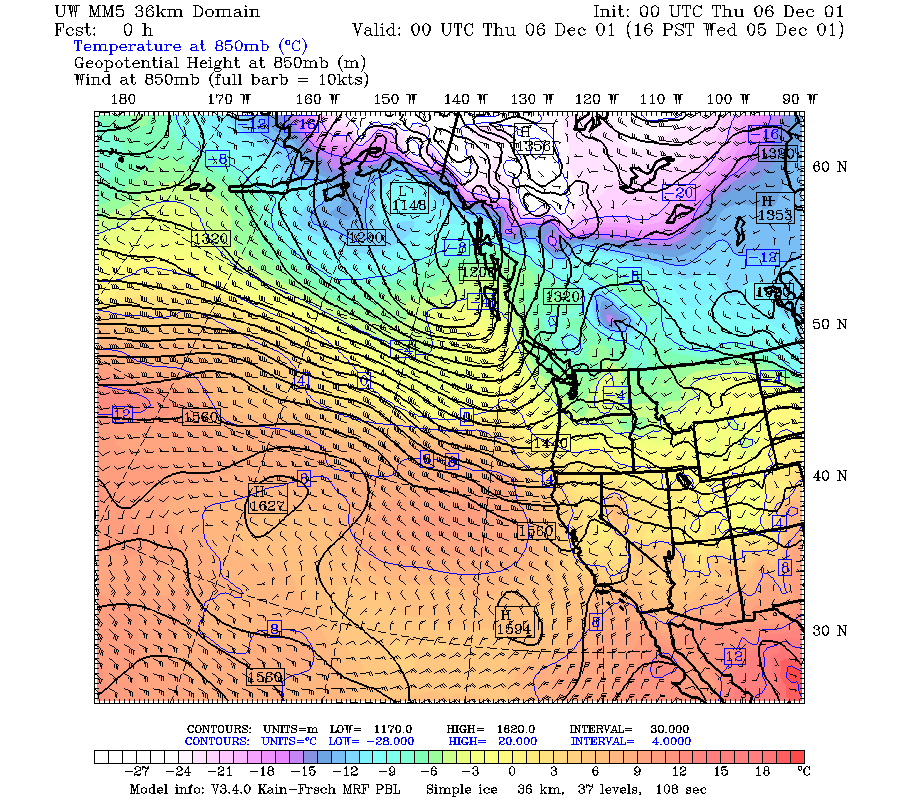
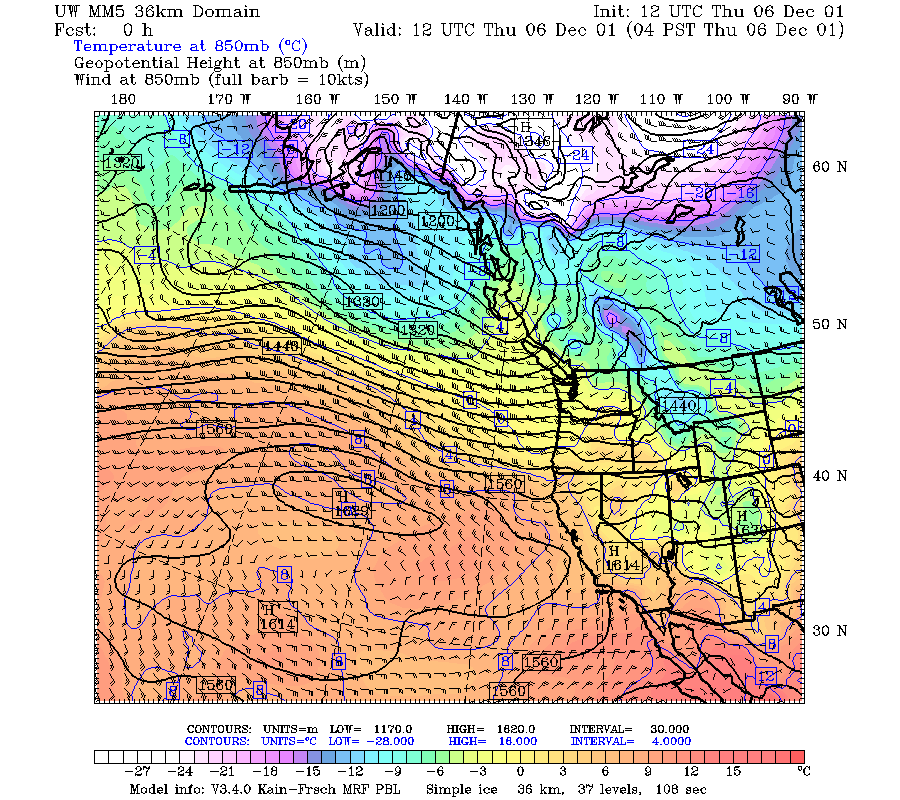
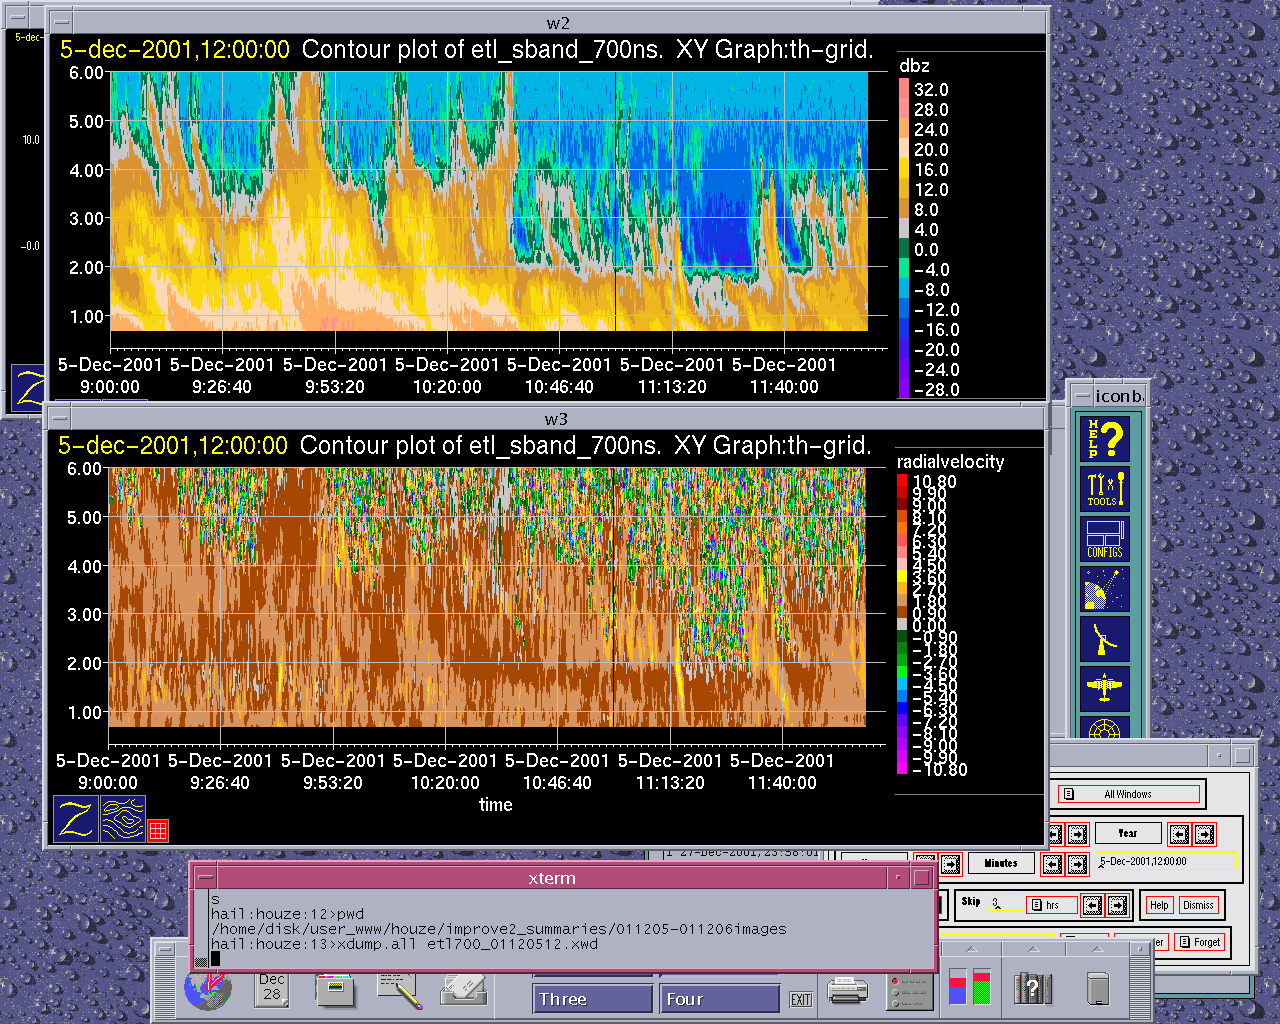
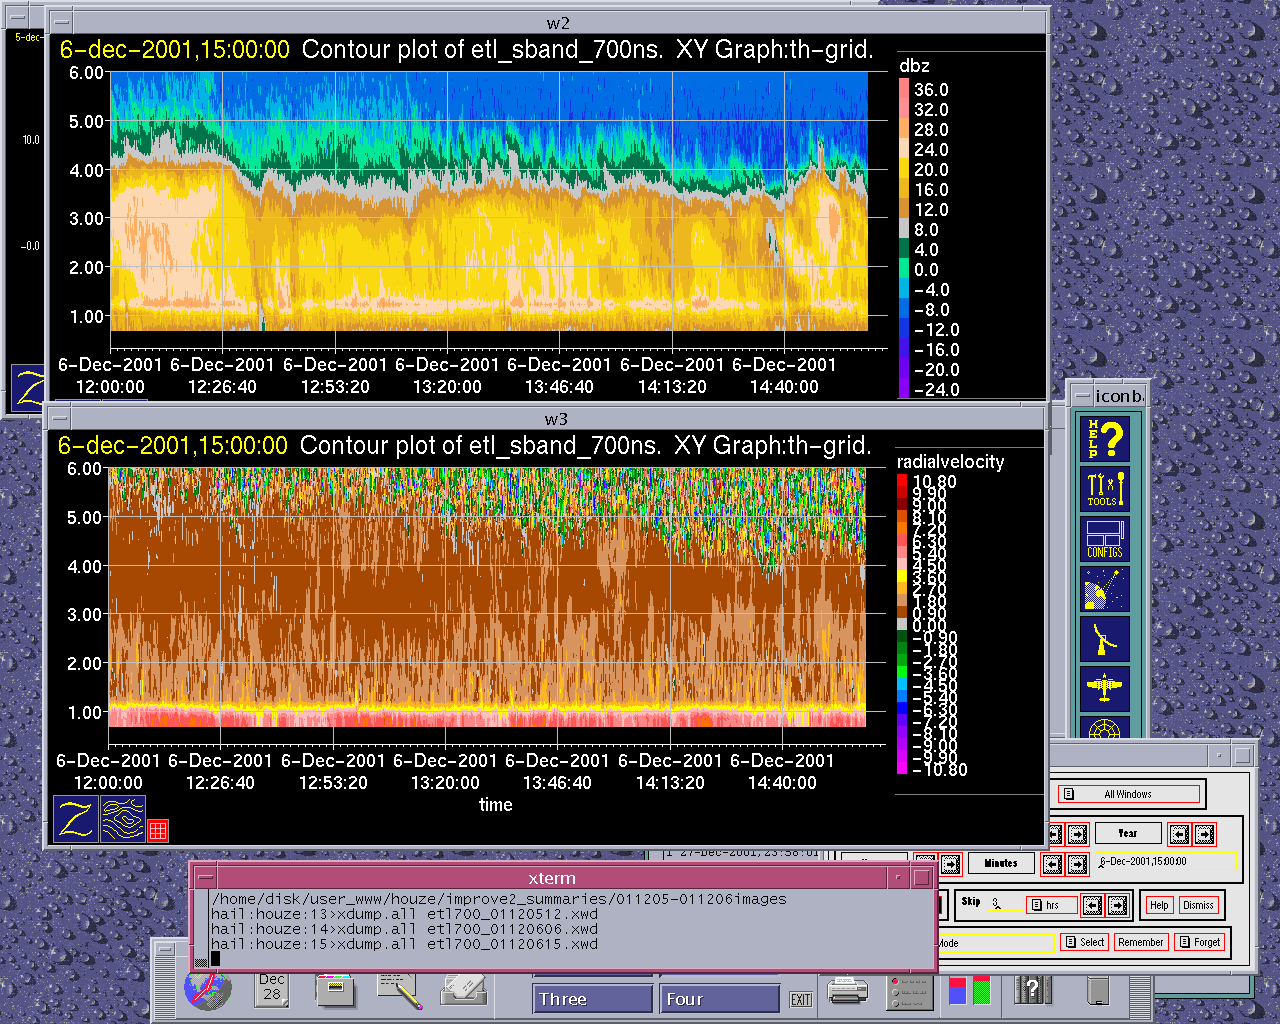
Another short wave and frontal cloud band crossed Oregon between about 0000 and 1200 UTC 6 December 2001. The 500 mb trough was at 135o west at 0000 UTC (Fig. 1a) and had moved past Oregon by 1200 UTC (Fig. 1b). The 850 mb wind was turning to southwesterly at 850 mb at 0000 UTC (Fig. 2a) and had turned westerly following the front at 1200 UTC (Fig. 2b). The satellite imagery for the 12 hour period preceding the passage of the frontal system showed an interesting development in the enhanced cloud top pattern in the southern half of the S-Pol radar area (Fig. 3a, Fig. 3b). Precipitation associated with this feature was present on the S-Pol radar at 1200 UTC 5 December (Fig. 4a). This feature was passing over the ETL S-band profiler between 1200 and 1500 UTC 5 December (Fig. 5a). The S-band profiler showed convective structure in the form of vertically extensive fallstreaks.
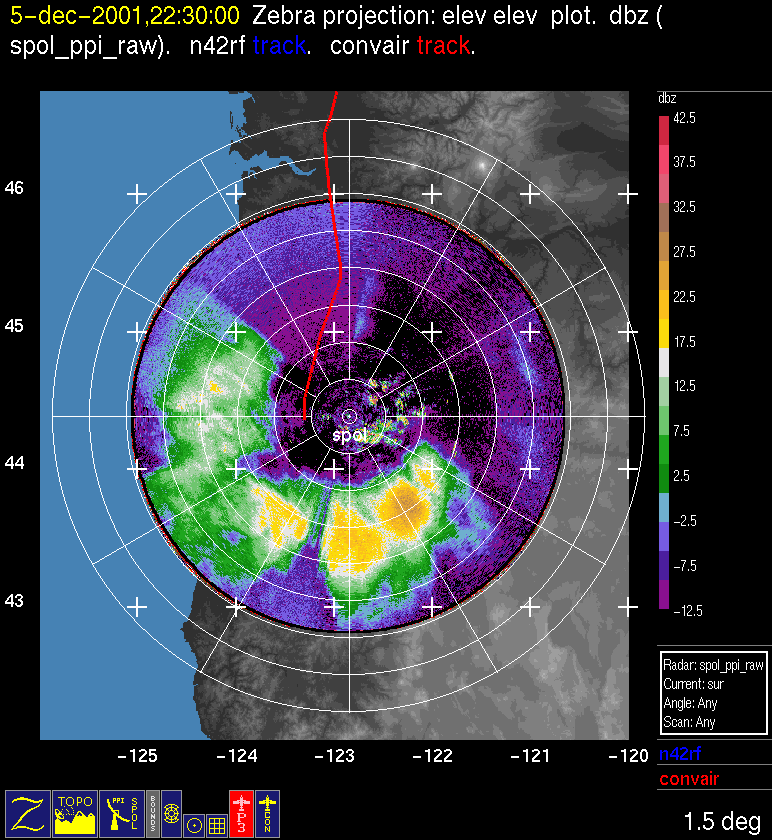
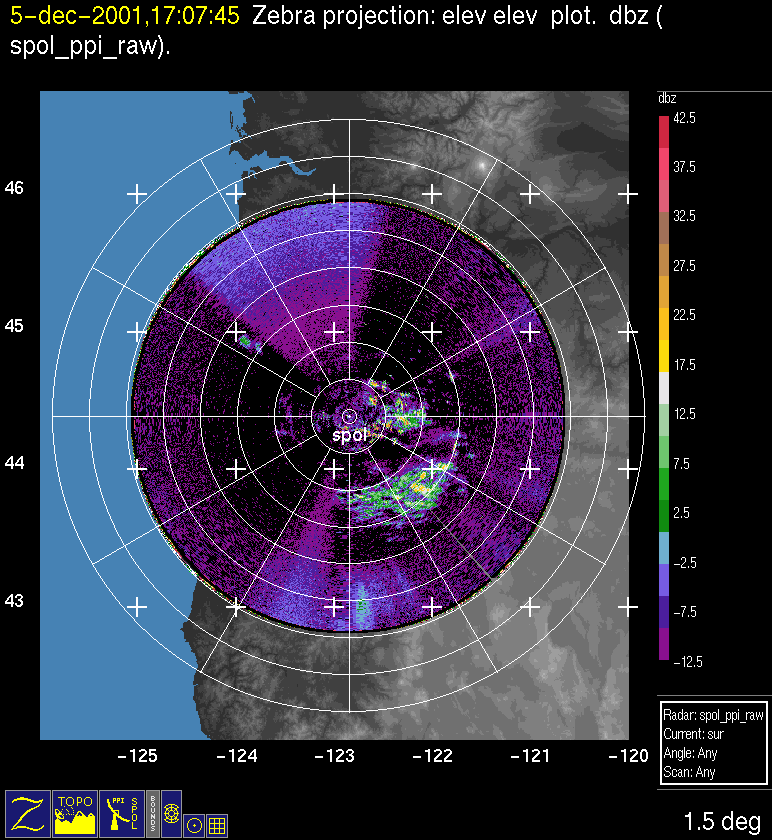
By 1700 UTC only postfrontal-type orographic showers were evident over the mountains east of the radar (Fig. 4b). The Convair flew a brief mission in the radar area at around 2200 UTC, as the echo aloft (as defined by the circular echo at the 1.5 deg elevation angle of the S-Pol display) was moving into the S-Pol radar area (Fig. 6).
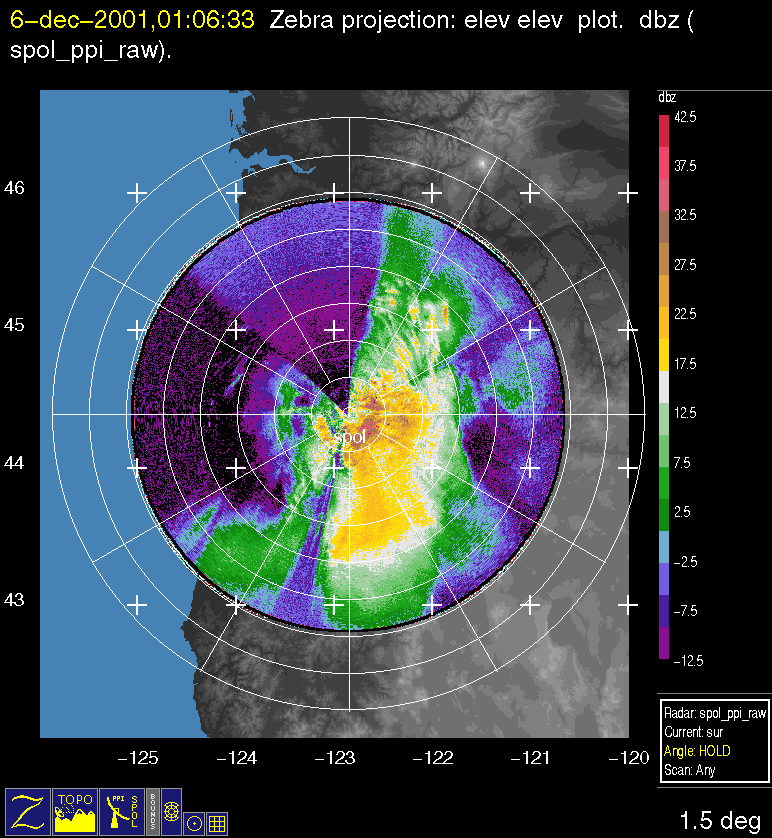
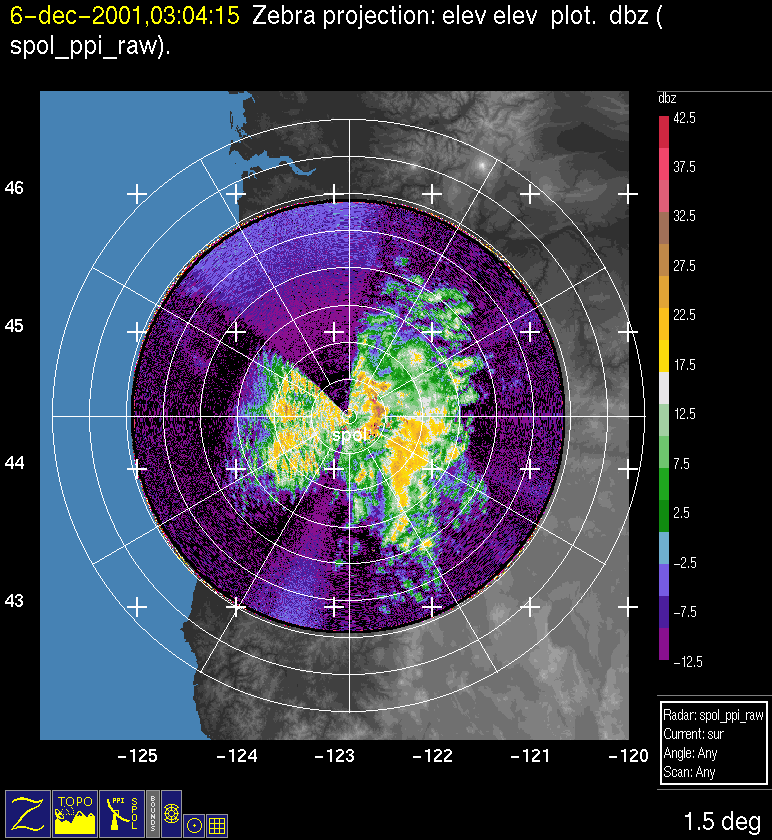
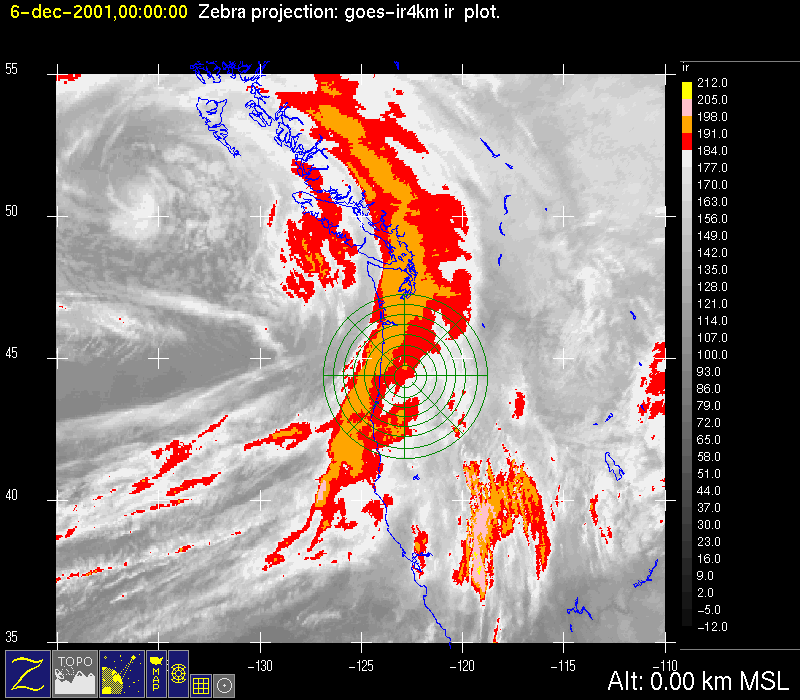
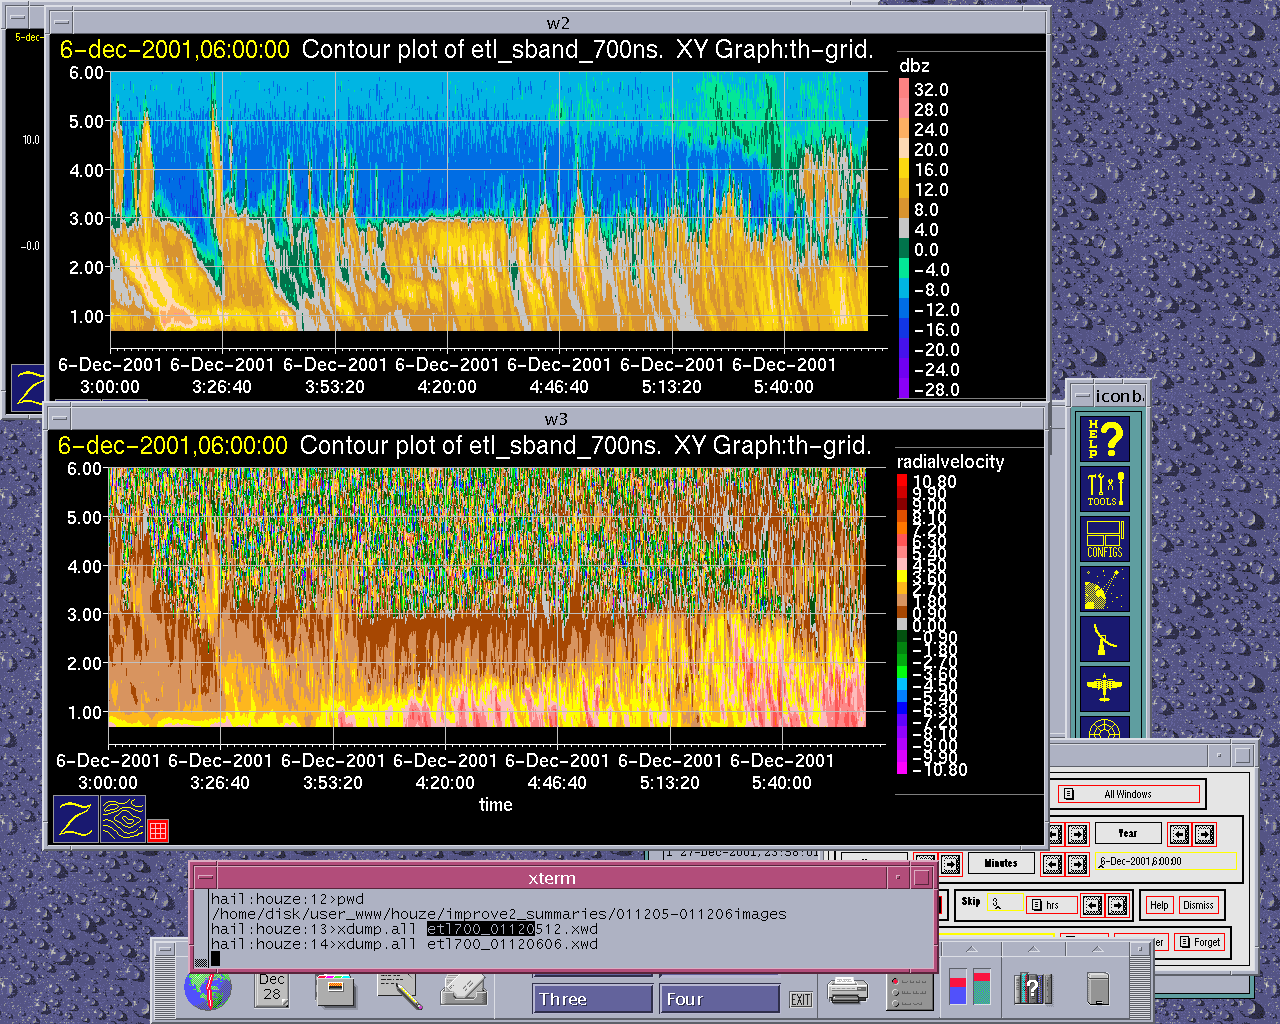
At 0000 UTC 6 December, the satellite imagery showed a solid SSW-NNE oriented band of cold cloud top passing over the radar area in association with the frontal system (Fig. 3c). On radar it appeared as a broad continuous region of light precipitation, with a bright band evident as a circle of high reflectivity near the radar in the 1.5 degree elevation base scan (Fig. 4c). Most of the echo in the picture is evidently snow above the 0 deg C level. At 0300 UTC, the echo in the frontal cloud band took on a fine scale cellular structure, seen both on the S-Pol radar and by the ETL S-band profiler (Fig. 4d, Fig. 5b) There was a double structure in the high cloud band associated with the frontal system.
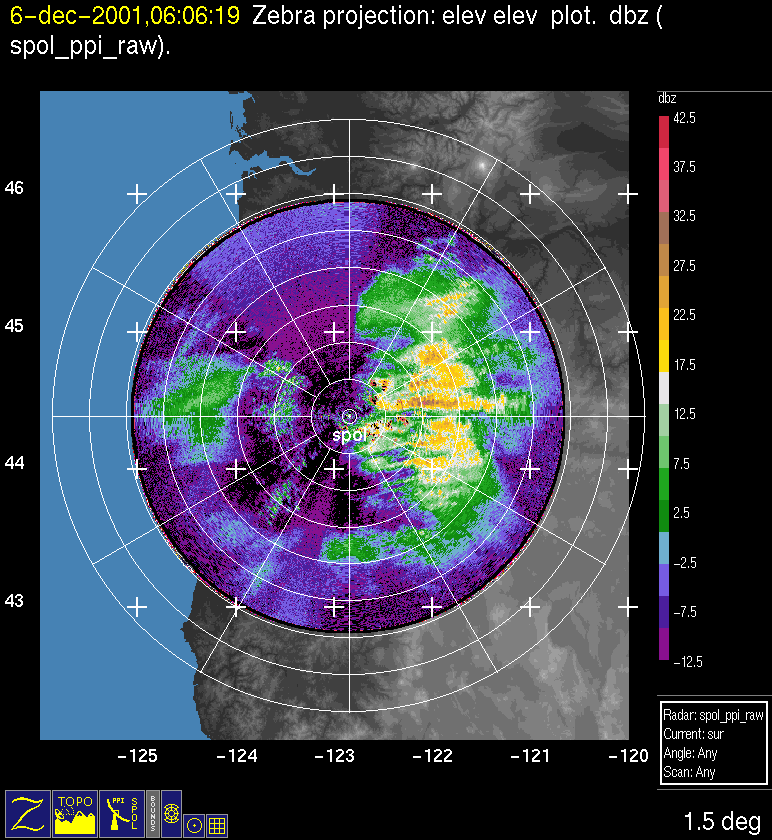
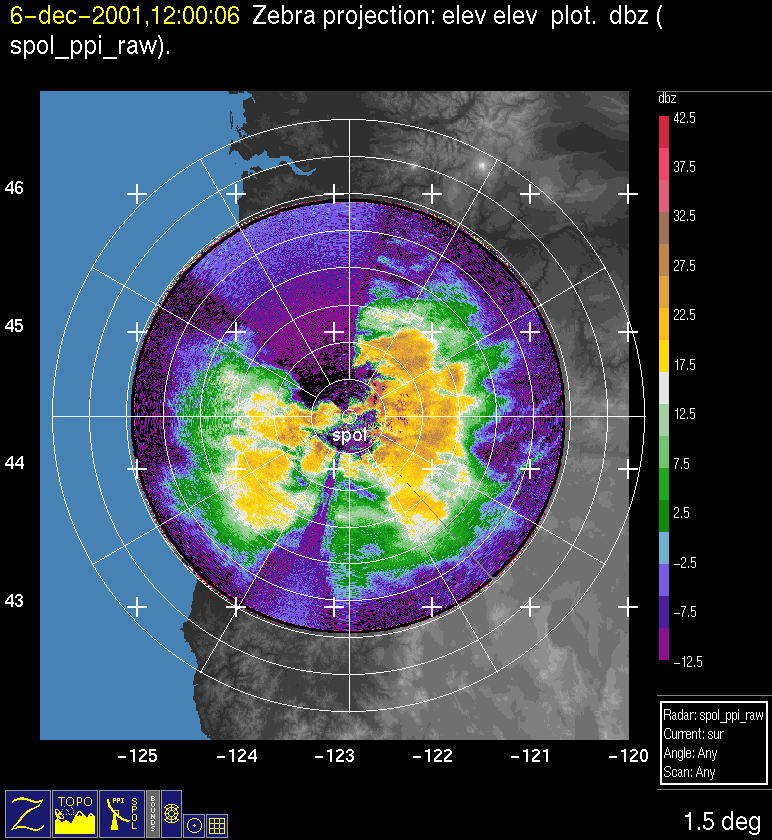
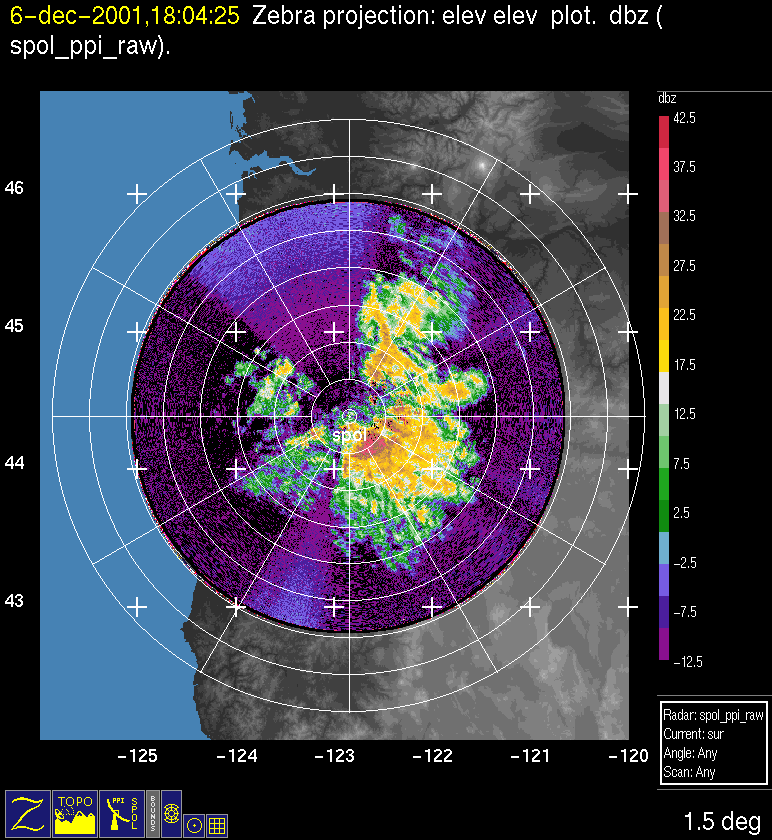
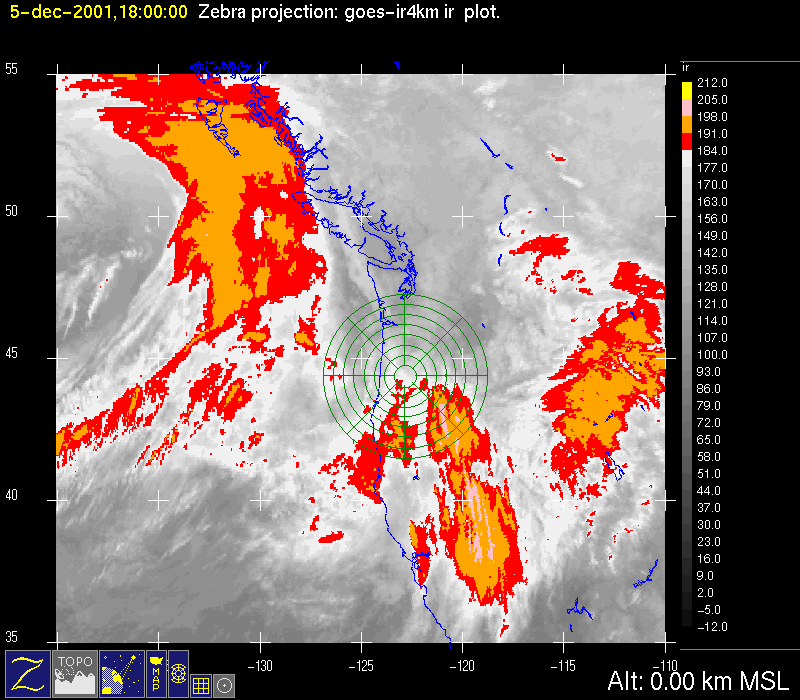
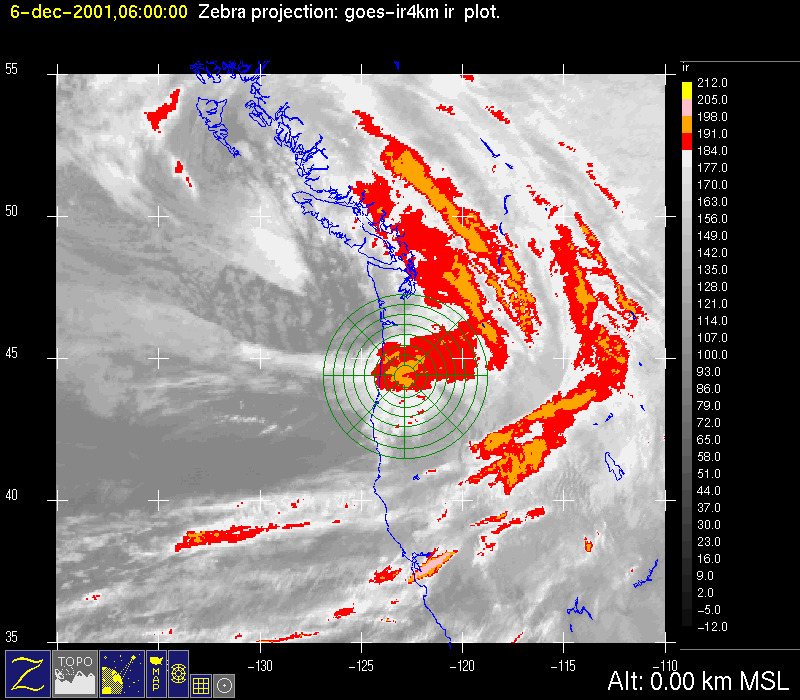
The second band of enhanced infrared imagery passed through the radar area at 0600 UTC (Fig. 3d). The back edge of this feature corresponded to the surface frontal passage. The radar echo associated with this cloud band associated with the front was generally very light except over the mountains where it was manifested as showers of moderate intensity, which were aligned in the manner of wavelike rainbands (Fig. 4e). For many hours following the frontal passage orographic clouds remained over the mountains in the westerly flow. The cloud tops were quite low (e. g. at 1200 and 1800 UTC; Fig. 3e , Fig. 3f). Despite the low cloud tops the precipitation in this postfrontal orographic regime was of moderate intensity (Fig. 4f, Fig. 4g). This persistent postfrontal orographic precipitation was at least as intense and continuous as the earlier prefrontal (Fig. 4c) and frontal (Fig. 4e) periods. The persistent postfrontal precipitation appeared on the ETL S-band profiler as a continuous layer of precipitation with a well defined melting layer and fine-scale embedded cellular structure (Fig. 5c).
Convair-580 Summary
UW Flight Number:
1896
Period of Flight:
2125-2249 UTC, 5 December 2001
Main Accomplishment of Flight:
Transit flight from Eugene, Oregon, to Paine Field, Washington. Passage through ice clouds and virga at ~13,000 ft over Oregon.
Instrument Problems:
As for UW Flight 1895.
Flight Scientist:
Peter V. Hobbs
Approximate UTC Timeline (Local time= UTC-8 hours) Activity for UW Flight 1896:
No timeline form
P-3 Summary
No flight
S-Pol Radar Summary
The S-Pol radar was run continuously in the same mode of operation for the entire length of the field project.
Summary of Mobile Upstream Sonde Launches
Launch times at: Creswell, OR, Lat: 43.9200, Lon: -123.0250, Elev: 165 m
0058 UTC 6 Dec
0358 UTC 6 Dec
0602 UTC 6 Dec
Summary of Leeside Sonde Launches
Launch times at: Black Butte Ranch, OR (a.k.a. ISS-3), Lat: 44.379, Lon: -121.679, Elev: 1027 m
0000 UTC 6 Dec
0300 UTC 6 Dec
0600 UTC 6 Dec
Summary of NWS Sonde Launches from Salem (SLE)
Launch times:
0000 UTC 6 Dec (standard)
0300 UTC 6 Dec (special)
0600 UTC 6 Dec (special)
Summary of Snow Crystal Ground Measurements
Measurement times:Every 15 minutes from
0000 UTC 6 Dec-0600 UTC 6 Dec (at Santiam Pass, Corbett, and Tombstone Sno Park)
and from
2000 UTC 6 Dec-0030 UTC 7 Dec (at Santiam Pass Sno Park)
